Bow Shock

Photo by Christian Nielsen at unsplash.com

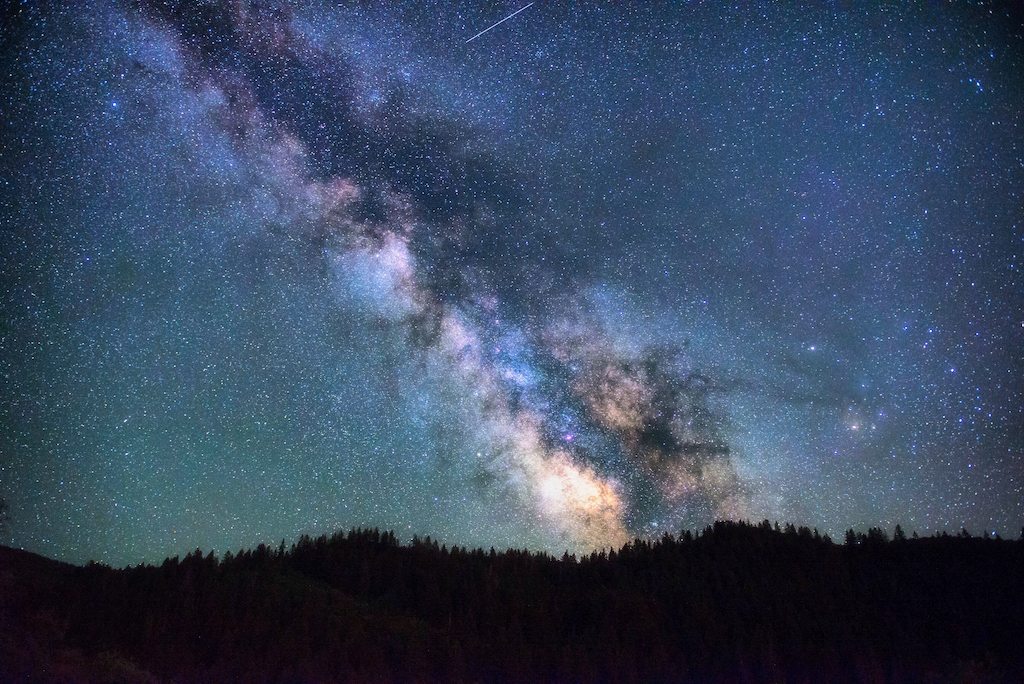
The film opens with a time-lapse of an astronomical observatory framed against a backdrop of stars rotating slowly overhead in the night sky. We hear foreboding music that suggests the inevitable passage of time. Then we see astronomers at work inside the observatory gathering data from various sensors and arrays aimed at nearby asteroids, distant stars, and far-away galaxies. Throughout the night, the scientists and staff deal with routine problems such as a faulty temperature sensor. Meanwhile, the telescope camera is methodically snapping images of celestial objects.

 The next morning, a young researcher notices an unusual visual pattern in the night’s data—a curved distortion in space that resembles a bow wave generated by a ship moving through the ocean. Such interstellar phenomena are called bow shocks. But this one seems to be different. She takes her discovery to the director of the astronomical institute, who is taping a public service video about their new telescope and state-of-the-art camera, which captures the telescope’s entire field of view and creates a tridimensional cartographic image of the sky. After she finishes recording the voice-over for the video, the director tells the young scientist to put her images from last night’s work on screen. They watch as the computer stitches the images into a time-lapse view of the bow wave moving diagonally across the starscape. The young researcher estimates that it is traveling at about one third the speed of light. More calculations reveal that the bow wave is passing through the Oort Cloud in the outer reaches of our solar system. Whatever it is, it’s right on our doorstep.

Then, the director points out something really astonishing…the bow wave appears to be slowing down.

Although the scenes depicted above are fiction, they were filmed at a very real observatory, newly built for the purpose of wide-field optical surveys of the universe—the Observatorio de Astrofísico de Javalambre located at Sierra de Javalambre in Teruel, Spain. The film, entitled “Bow Shock” is a collaboration between filmmaker Javier Diez and scientists from the Javalambre Physics of the Accelerating Universe Astrophysical Survey (J-PAS). It was screened at the 2016 Imagine Science film festival and later archived at Labocine—a platform for new-wave science films. Watch it here: Bow Shock.

We are all familiar with science fiction films, which often take us to the edges of human imagination: The Day the Earth Stood Still, 2001: A Space Odyssey, Blade Runner. Alien. But Bow Shock belongs to a new genre called “scientific fiction”, which is a cross-fertilization of science fact and cinema. Emphasis is on getting the technical details right (something Hollywood often fails at) while telling a compelling story (something Hollywood excels at). In this particular film, the observatory and its research goals are real, but the story being told (about the bow wave discovery) is fictional. The idea is to provide an accurate account of the science while telling an intriguing story of how scientists of the future might use this new observatory to spot evidence of extraterrestrial life or other celestial phenomena. It’s an interesting approach that, in my opinion, has a lot of promise.

Bow Shock is a good example of scientific fiction—in this instance with actors playing the parts of scientists and observatory staff. The film is technically sound, well made with eye-popping visuals of astronomical techniques, and tells an intriguing story. Information about the observatory’s unique telescope and camera system is cleverly conveyed in the fictional story by having one of the characters record a public service video summarizing key features of the system. This approach is much more palatable than having a scientist give a dry, awkward speech on camera to introduce the observatory and its equipment. The fictional story about the bow wave does more than capture and hold the viewer’s attention while the more technical aspects are presented. It illustrates how astronomers look for unusual patterns in data collected with telescopes. By featuring the bow wave phenomenon, the film not only shows how astronomical research is conducted, but also how the observatory might make important discoveries in the future.

Of course, the biggest discovery would be to find signs of extraterrestrial intelligence. The film hints at this possibility, and the scientist actors speculate about how First Contact might occur and what response we might expect. This focus on First Contact takes advantage of people’s fascination with the question of whether life exists outside the Earth. There’s also a bit of historical irony in the film when the Spain-based astronomers recall what happened when Spanish conquistadors encountered the people of the New World. The analogy between early (Spanish) explorers sailing the oceans in search of new trade routes and spacefaring aliens sailing across the galaxy suggests to the viewer some potential outcomes based on known historical encounters. In other words, the film gives the viewer a lot to think about, but without resorting to exaggeration of the science.

Using scientific fiction to convey information about science is an interesting idea. Scientists often struggle to talk about their research in a way that is both understandable and appealing to the average person. Scientific fiction might be helpful in this regard, especially to show how a line of research might lead to breakthroughs in the future. By taking this approach, science filmmakers can spark people’s imagination about what discoveries a line of research may reveal. Humans are hard-wired to get their information in the form of a story. And, making such a film could be a lot of fun. Bow Shock was made by professional filmmakers and actors, but such a film could be made by a group of scientists or science students collaborating with film school faculty and students, for example. The scientists would ensure that the technical details were conveyed accurately, and the filmmakers would provide the cinematic expertise and acting talent. Coming up with a fictional story that is scientifically accurate would be challenging, but could be enlightening for the scientists involved. For more examples of scientific fiction films, check out the Labocine series.

Of course, you don’t have to make up a story to create a compelling film about science or scientists. In my next post, I’ll talk about taking a documentary approach to making films about science that resonate with viewers who otherwise have little interest in science.

Science Communication, Artificial Intelligence, and Hollywood

This is the first post in a series about Artificial Intelligence (AI) and how it might help scientists be better communicators. In this post, I introduce the topic.

Consider this futuristic scenario:

4246476627_f40c638984_oA scientist is working on a grant proposal and must create a three-minute video synopsis of what she plans to do with the funding and how her research will benefit society. This video synopsis is one of the required components of proposals submitted to government funding agencies. She logs onto a platform in the Cloud and uploads video clips showing her and her team working in the laboratory and talking on camera about the potential applications of the proposed research. An AI (Artificial Intelligence) system analyzes all of the uploaded information, as well as millions of images, animations, and video clips in the public domain. Within minutes, the AI system has identified the key components necessary to address the stated goals of the funding opportunity and has produced a draft video of the required length that is both intellectually and emotionally stimulating. The scientist takes the draft video file and makes a few edits based on her knowledge of the field and potential reviewers. She renders the final video and attaches it to her application package, which she submits to the funding agency. Her proposal is funded, and the funding agency uses her video synopsis on their website to inform the public about the research they are supporting and how it may affect them.

Far-fetched? Perhaps not. Recently, I was watching an episode of GPS in which Fareed Zakaria interviewed the CEO of IBM, Ginni Rometti, and my ears perked up when they talked about an AI helping a film editor cut a movie trailer, reducing the time required from weeks to a day. The movie studio, 20th Century Fox, recently collaborated with IBM Research and its computer Watson to produce the first computer-generated movie trailer for the science fiction film Morgan, which is about, appropriately enough, an artificially enhanced human.

Watson was trained to “understand” what movie trailers are and then to select key scenes from the full-length movie to create a trailer that would appeal to movie-goers. A similar approach could be applied to scientific information to produce a video proposal that resonates with peer reviewers and panelists, as in the hypothetical example above….or a video abstract to inform the scientific community about a recent journal article. The idea here is that a busy scientist may one day be able to use AI to rapidly scan a vast storehouse of data—much faster and more thoroughly than a human—and then to suggest the best material and design for an information product such as a video.

AI is being considered as a way to enhance many activities involving the analysis of large amounts of data—such as in the medical or legal fields. Using AI to create movie trailers or science videos may seem to be a trivial goal compared to making a more accurate medical diagnosis; however, when you consider how important it is for science professionals to be good communicators, the idea seems worthwhile. In the coming posts, I’ll explore this topic further and provide a bit more detail about how IBM’s Watson was used to create a movie trailer.

This post is part of a series about Artificial Intelligence (AI) and its potential role in science communication. In the next post (part 2), I’ll provide more information about Watson, the computer.

Blocked

The_Great_Wall_of_China_at_Jinshanling-edit“If you open the window for fresh air, you have to expect some flies to blow in.” That was a favorite saying of Deng Xiaoping, who was referring to China’s economic reform that would ultimately transform the country. China’s decision to open its doors to foreign investment and western knowledge also let in the Internet and foreign ideologies. To keep those “flies” away, the Chinese government has implemented The Great Firewall of China—an Internet censorship and surveillance program.

I’m currently in China where access to social media (Twitter, Facebook), YouTube, Google, and many other sites is blocked. A number of media sites such as CNN and the New York Times are also blocked (you can test whether a website is blocked by using https://www.comparitech.com/privacy-security-tools/blockedinchina/ Update 5/25/16: if previous site is unavailable, try this one https://www.vpnmentor.com/test-the-great-china-firewall/). Not only that, the government surveillance encourages self censorship because Internet users believe they are being watched and could potentially suffer legal and economic consequences if they do not adhere to the government policy. The blockage of sites I take for granted at home means I cannot (easily) get to my g-mail, Twitter, and YouTube accounts. In addition to the inconvenience, such censorship is quite disturbing to someone accustomed to Western freedoms and beliefs.

The irony is that it’s possible to jump over the Great Firewall, and many people here do. How that’s accomplished requires an understanding of how the Great Firewall works, which is technically quite interesting. There are three main ways Internet access to certain sites is blocked. The first is IP Blocking, which works by blocking all access to a known IP address. For example, www.facebook.com (a domain) maps to a known IP address; any attempt at connection is immediately disconnected (I would get messages saying that the server was unavailable, or the connection attempt would time out). The second way is called IP Address Misdirection, which does exactly what the name suggests. You might type in a url, www.lsu.edu, but the Firewall will send you to a fake address, www.misdirected.lsu.clone.edu. The final method is called Data Filtering, in which an Internet search involving certain keywords (e.g., Tiananmen Square) will be intercepted and the content of the resulting URLs examined. If the URL is on the censored list, then access to that site is blocked.

Through the use of VPNs (virtual private networks) and other proxies, Chinese citizens and visitors like me can circumvent the firewall. These work by routing information through a server located elsewhere, for example, California. Your IP address is thus changed so that it appears you are located in the US, and your web activity is also encrypted. This change bypasses the various blocking procedures described above. However, Chinese authorities have begun identifying and blocking some of the more popular VPNs, making it a bit more difficult for the average person to jump the firewall. I found one that is currently working and is allowing me to (so far) post things on banned sites such as Twitter.

I knew about the firewall prior to this trip (having visited China before) and had assumed that Chinese viewers were unable to see my YouTube videos. Chinese colleagues also had mentioned to me that YouTube was not accessible in China. I now know that is not entirely true. In fact, a friend who is from China but lives in the US said that her friends back home told her about “The Scientist Videographer” and video tutorials. They were talking about using a GoPro to capture video, and her friends mentioned a tutorial showing how to shoot and edit a slow-motion video, which showed a hummingbird. After a moment’s confusion, she realized they were talking about someone she knew—me and my YouTube tutorials.

There is much, much more to this topic (see this NY Times article for an in-depth description) than I could cover in a brief post.

Image Credit: Wikipedia Creative Commons CC-BY-SA 3.0, uploaded by Brandmeister

How to Write an Abstract for a Scientific Paper

640px-Everest-fromKalarPatarWriting a scientific article can be an intimidating and challenging task for first-timers. I vividly recall my first effort. I was initially overwhelmed with the idea because I was thinking about the entire paper in the same way an amateur mountaneer might view Mt. Everest: one long climb to the top. How would I ever reach the summit when I’ve never set foot on a mountain before?

(Image by Uwe Gille, CC-BY-SA 3.0)

Fortunately, someone suggested to me that I break the job down into small parts and stop thinking about it as one huge task. They also suggested that I study published papers to see how each section was structured and then organize my narrative in a similar way. This piece of advice—to study the structure and writing style of well-written articles—helped me enormously, especially in the early days of preparing research articles for publication.

Over the succeeding years, I periodically “analyzed” papers—those in high-impact journals as well as those I just enjoyed reading—to discover ways to improve my own writing. Along the way, I realized that getting one’s work into top journals depended on how well the paper was written, in addition to ground-breaking research findings. I thus found it strange that my professors did not coach students in improving the quality of their scientific writing. A few professors had their students analyze papers in courses or lab group discussions, but the focus was on evaluating the science aspects of the article rather than the writing.

One section of my scientific papers that I initially did not spend much time crafting was the abstract. Like many novice writers, I left the abstract until last and then dashed off a mediocre summary composed of sentences mostly cut and pasted from the narrative. It was only much later that I understood the abstract to be one of the most important components of a scientific paper. The abstract is often the only section of a paper that is read. More importantly, the abstract can determine whether a reader downloads and reads the rest of the paper. Or, in the case of a conference paper, the abstract will determine whether it is accepted or not for presentation to colleagues. Journal editors and reviewers and conference organizers pay close attention to the abstract because it is a good predictor of the quality of the paper. A poorly written or mediocre abstract says the author is inexperienced or doesn’t care about quality.

Writing a decent abstract is not difficult…if you know what information needs to be included and how to structure it. The presentation embedded below explains how to write an abstract using a real example of a published abstract. I selected the example from one of my own publications–not because it’s particularly good, but because it illustrates some dos and don’ts. And, by using one of my own publications, I won’t embarrass anyone but myself!

Note that there is audio associated with each slide, so be sure to adjust the volume on your device (here is a direct link in case you cannot see the player window below).

Knowing how to condense a scientific article into a short, coherent summary is a handy skill that all science professionals should attain. If you’ve never written an abstract before, this guide should make the task a bit easier.

What To Do With All Those Research Photos: Tell a Visual Story

chasingmudsmallMany researchers, especially those of us who conduct fieldwork, have thousands of photos taken during the course of studies we have conducted—of field sites, equipment, procedures, study organisms, and people. Take the photo at left, for example. I took it during a helicopter survey of marsh sedimentation following the 2011 flood of the Mississippi River. The data we collected were ultimately reported in a couple of journal articles, here and here, but most of the photos remain unpublished.

Photos like this, however, are useful in documenting the conditions encountered during field trips, the procedures employed to collect samples, experimental setups, laboratory protocols, as well as many other aspects of the research. In this study, I additionally photographed each sample site from the air and on the ground, generating a visual record of the vegetation and landscape features.

Scientists most often use such research photos in presentations given at conferences or seminars and, to a lesser extent, in journal articles and book chapters. Some of us also share random images through social media (Twitter, Facebook, Instagram). In most cases, though, these photos simply sit in our files and never see the light of day. This is unfortunate, however, because such images represent important and potentially useful information.

How can we put our research images to better use?

There are many possibilities, but I’ll focus on two options in this post, which is to use photos to craft (1) a visual abstract that summarizes a journal article and (2) a narrative that delves into those aspects of research that are not typically described in a paper (the challenges you faced during the study, the importance of your work to society). In both cases, the researcher is able to visually amplify their work and share it with others.

Create a Visual Abstract

One way to use research photos is to augment a journal article with a visual abstract, which is a summary that uses images instead of text to briefly describe the findings of a study. Research photos can be combined with diagrams, graphs, animations, and text to provide a visually-rich overview of the study. These are images that enhance understanding of the research methods, study sites, potential applications, and other aspects, but are typically not included in journal articles because of page limitations and other constraints imposed by traditional formats (this may change to some degree with electronic publications).

A visual abstract can be created and published alongside the article as supplementary online material, on an independent media-sharing site, or on the author’s website. Once online, the visual abstract acts to attract attention to the paper and allows a deeper exploration of the research described in the text narrative. Most importantly, a visual abstract organizes your research photos to create a coherent narrative—something posting individual images of research cannot do as effectively.

A simple way to create a visual abstract is with a slideshow organized to take the viewer sequentially through each stage of the research. I’ve recently produced two visual abstracts using the presentation application, Prezi. These abstracts are designed somewhat like a poster or infographic, except instead of a static image, they are interactive.

PowerPoint, Keynote, or some other application might be used to create a visual abstract or infographic. I chose Prezi, however, because of its multi-dimensional, non-linear canvas, which lets you create an explorable document that also can be shared easily via a link or embedded in a website. With Prezi, you can arrange the “frames” in a single plane to create a pleasing overview and then use the “zoom” function to bring each frame into full view, creating a narrative.

There are many ways to design a visual abstract. The two examples I created used a simple design with one photograph acting as an anchor image and other images and text provided in frames positioned alongside the main image. I’ve embedded the two Prezi visual abstracts below.

The first visual abstract summarizes a paper to be published in the Annual Review of Marine Science. Even though this paper was a review, I was able to produce an informative visual abstract using photos (and diagrams) that illustrated various aspects of the review topic. The visual abstract distills the paper down to a few key points, which are covered in greater detail in the technical paper. Here is the direct link: http://prezi.com/dtfasu6khdti/?utm_campaign=share&utm_medium=copy&rc=ex0share

The second visual abstract summarizes a paper published in 2008 in the Smithsonian Contributions to the Marine Sciences. Although the paper was published seven years ago, the topic is still relevant. Unfortunately, the paper does not rank high in a Google search. Consequently, I decided to create a visual abstract to help raise the online visibility of the paper. My colleagues and I had taken hundreds of photos during that study that could be used to share information about the study location, the methods, the results, and the broader implications of the work. I selected the best ones and combined them with public domain images, graphs, and text to summarize the study. Here is the direct link: http://prezi.com/vaijezkevszk/?utm_campaign=share&utm_medium=copy&rc=ex0share

As I said, there are many ways to design a visual abstract. Here is another option, which I’ve made available as a free template on the Prezi platform. You can download it and then replace my images and text with your own.

After creating a visual abstract, you can send the link to colleagues or embed it on your website. The ideal approach is to create and post a visual abstract before or concurrent with publication of the paper. That way, the abstract can act like an advertisement for the pending publication and build a pool of potential readers. But there is no statute of limitations on visual abstracts, especially if you’ve got a library of photographs from previously-published studies.

Create a Visual Narrative

Although researchers in your field may be primarily interested in the technical aspects of your work, there is a larger audience of people who want to hear about what motivated you to conduct your study or what it’s like to conduct research on a tropical island in Belize. This group includes students, scientists in other fields, policy-makers, the media, and the general public. Scientists have compelling stories to tell that help others understand the nature of research as well as why scientific research is needed. Such stories are also helpful in getting the average person interested in science and in topics of critical importance to society.

A visual narrative, constructed with a series of photos, can be used to tell the “backstory” of a research project….an expedition to the Congo, for example (see below). Visual narratives can provide insights into a research project that typically do not make it into the journal article but are useful in conveying the challenges researchers faced in collecting samples, the beauty of the ecosystem under threat, or the broader impacts of the findings on society.

Such stories appeal to students and the general public and can get people interested in your research topic.

As you will see in the video below, the filmmaker used mostly still images to tell the story of how researchers from the Woods Hole Research Center studied the Congo River. This example shows that with some creative editing, photographs can be arranged to tell a powerful and effective story.

Some Practical Considerations

You may be wondering just how long does something like this take? In the case of the visual abstracts, the time required was about what it would take to put together a PowerPoint presentation. In fact, for the second visual abstract, I imported a PowerPoint slide deck, which I had previously used for a presentation, into Prezi and then simply rearranged the images and added text. You don’t have to use Prezi, but if you do, it is relatively easy to learn. If you already know how to use movie-editing software (iMovie Tutorial for iOS), creating a visual narrative of still images should not be overly taxing either.

Of course, to create a visual abstract or narrative, you must have the necessary images, and this takes planning. I got into the habit early in my research career of photographically documenting experiments and fieldwork. I made a list of photos I needed and then set aside time during a field trip to search out and snap those images. I took photographs not only of things related to my research but also of the plants, animals, soils, landscapes, and people I encountered. During long field expeditions (a week or more), I would typically spend an entire day just taking photographs. Back in the days of 35 mm film, however, I had to be somewhat parsimonious and carefully select what to photograph. Once digital cameras became available, I spent more time photographing—to document changes in the habitats I studied or to record visual features that might later prove useful in interpreting my results. Now, with phone cameras in our back pockets, it’s even easier to take, store, share, and reuse research photos.

As I’ve explained in a previous post, visuals can help make your research more visible online. Although you might present your research photos individually in an online repository, the viewer likely will have no understanding of what they are seeing or why it is important. I think it is much better to organize those photos to tell a story about your work. Visual abstracts and visual narratives are a great way to accomplish this.