How to Write an Abstract for a Scientific Paper

640px-Everest-fromKalarPatarWriting a scientific article can be an intimidating and challenging task for first-timers. I vividly recall my first effort. I was initially overwhelmed with the idea because I was thinking about the entire paper in the same way an amateur mountaneer might view Mt. Everest: one long climb to the top. How would I ever reach the summit when I’ve never set foot on a mountain before?

(Image by Uwe Gille, CC-BY-SA 3.0)

Fortunately, someone suggested to me that I break the job down into small parts and stop thinking about it as one huge task. They also suggested that I study published papers to see how each section was structured and then organize my narrative in a similar way. This piece of advice—to study the structure and writing style of well-written articles—helped me enormously, especially in the early days of preparing research articles for publication.

Over the succeeding years, I periodically “analyzed” papers—those in high-impact journals as well as those I just enjoyed reading—to discover ways to improve my own writing. Along the way, I realized that getting one’s work into top journals depended on how well the paper was written, in addition to ground-breaking research findings. I thus found it strange that my professors did not coach students in improving the quality of their scientific writing. A few professors had their students analyze papers in courses or lab group discussions, but the focus was on evaluating the science aspects of the article rather than the writing.

One section of my scientific papers that I initially did not spend much time crafting was the abstract. Like many novice writers, I left the abstract until last and then dashed off a mediocre summary composed of sentences mostly cut and pasted from the narrative. It was only much later that I understood the abstract to be one of the most important components of a scientific paper. The abstract is often the only section of a paper that is read. More importantly, the abstract can determine whether a reader downloads and reads the rest of the paper. Or, in the case of a conference paper, the abstract will determine whether it is accepted or not for presentation to colleagues. Journal editors and reviewers and conference organizers pay close attention to the abstract because it is a good predictor of the quality of the paper. A poorly written or mediocre abstract says the author is inexperienced or doesn’t care about quality.

Writing a decent abstract is not difficult…if you know what information needs to be included and how to structure it. The presentation embedded below explains how to write an abstract using a real example of a published abstract. I selected the example from one of my own publications–not because it’s particularly good, but because it illustrates some dos and don’ts. And, by using one of my own publications, I won’t embarrass anyone but myself!

Note that there is audio associated with each slide, so be sure to adjust the volume on your device (here is a direct link in case you cannot see the player window below).

Knowing how to condense a scientific article into a short, coherent summary is a handy skill that all science professionals should attain. If you’ve never written an abstract before, this guide should make the task a bit easier.

Use Video to Share Your Dissertation Research

Increasing numbers of scientists and graduate students are posting videos that show various aspects of their research—in the laboratory and the field. Such videos serve many purposes, both for the researcher and for society. Take a look at this example and then we’ll talk about the benefits of making such a video.

Videos that depict scientists and students doing their research can have multiple benefits—both for the individual researcher, as well as for society.

1. Raise visibility. Early career scientists struggle to make a name for themselves in their chosen field. The traditional approach is to publish in journals and to present at science conferences. Those forms of formal communication of science are still important, but now there are additional tools that scientists can use to share their work: social media, science blogs, and videos. The video example above highlights the dissertation research of a Ph.D. student at Charles Darwin University, Mike Miloshis, who is studying how sea-level rise is changing the wetlands along the Mary River. Well-done videos like this can be used by the student or by the student’s department or university to more easily share their work with prospective employers or funders, policy-makers, the media, and the general public.

Only a handful of people will likely read your dissertation, but many more will be willing to watch a video showing what you did, how you did it, and why it’s important.

2. Solicit funding. Video is an excellent way to explain your research to prospective funders—particularly people without a science background. Crowd-funding platforms are springing up that require investigators to submit their research proposal in the form of a brief video. Members of the scientific community and the general public watch the videos and pledge a donation or vote for those projects they wish to support. One example is Thinkable, which just awarded $5,000 (AUD) to an Australian cancer researcher and is about to award almost $15,000 (AUD) in another competition based on submitted 3-minute videos.

Those students and established scientists with video skills are at a clear advantage in such competitions.

3. Augment a CV or resume´. Video is an effective and efficient way to share information about a researcher’s unique interests, skills, and accomplishments. A video can paint a picture that is more distinctive and memorable than a written description in a resume´ or on a website. In a few short minutes, the video above showed this researcher’s general knowledge of his topic and ability to communicate it, as well as his expertise with various types of scientific equipment. Because it’s visual, video makes that information more memorable. It’s especially effective at getting across intangible qualities such as enthusiasm, confidence, energy, creativity, eloquence, and humor.

See this post for more information about making a video resume´.

4. Recruit students. A video can not only solidify a distinctive image for a researcher, it can serve as a great recruiting tool for an academic looking to attract students or post-docs. The video above depicts what it’s like to do river research and explains why the topic is important to study without getting too bogged down in scientific details. In a broader sense, such videos can show other students what graduate research is like in a particular field and what some of the challenges are.

By encouraging students to make videos about their experiences, schools can attract prospective students and help them anticipate what they will face in graduate school.

5. Inform the public. In addition to benefits for the individual researcher, videos can simultaneously inform the public about the importance of a research topic and the nature of scientific research. The average person is curious about science but may view it as a mysterious process conducted behind closed doors by socially awkward, introverted, cold, mad, obsessive, [insert your stereotype] people. Many envision a lab-coated, old guy toiling away in a laboratory.

Videos like the above example show that research is carried out in all kinds of environments and by perfectly normal people. In other words, videos can help put a human face on science.

How do you create a video to portray your dissertation research? You have a couple of options: join forces with a videographer or do it yourself. The video example I’ve highlighted in this post was a joint production between the graduate student and a videographer friend. If you are studying at a university, try approaching someone with multimedia skills.

If that doesn’t work out, you can make the video by yourself or perhaps with the help of a fellow student or your advisor. Making videos is now quite easy with mobile devices that shoot HD video and simple-to-use yet powerful movie editing software. A smartphone is truly all you need these days to create a professional and effective video to share your unique qualities with others.

What To Do With All Those Research Photos: Tell a Visual Story

chasingmudsmallMany researchers, especially those of us who conduct fieldwork, have thousands of photos taken during the course of studies we have conducted—of field sites, equipment, procedures, study organisms, and people. Take the photo at left, for example. I took it during a helicopter survey of marsh sedimentation following the 2011 flood of the Mississippi River. The data we collected were ultimately reported in a couple of journal articles, here and here, but most of the photos remain unpublished.

Photos like this, however, are useful in documenting the conditions encountered during field trips, the procedures employed to collect samples, experimental setups, laboratory protocols, as well as many other aspects of the research. In this study, I additionally photographed each sample site from the air and on the ground, generating a visual record of the vegetation and landscape features.

Scientists most often use such research photos in presentations given at conferences or seminars and, to a lesser extent, in journal articles and book chapters. Some of us also share random images through social media (Twitter, Facebook, Instagram). In most cases, though, these photos simply sit in our files and never see the light of day. This is unfortunate, however, because such images represent important and potentially useful information.

How can we put our research images to better use?

There are many possibilities, but I’ll focus on two options in this post, which is to use photos to craft (1) a visual abstract that summarizes a journal article and (2) a narrative that delves into those aspects of research that are not typically described in a paper (the challenges you faced during the study, the importance of your work to society). In both cases, the researcher is able to visually amplify their work and share it with others.

Create a Visual Abstract

One way to use research photos is to augment a journal article with a visual abstract, which is a summary that uses images instead of text to briefly describe the findings of a study. Research photos can be combined with diagrams, graphs, animations, and text to provide a visually-rich overview of the study. These are images that enhance understanding of the research methods, study sites, potential applications, and other aspects, but are typically not included in journal articles because of page limitations and other constraints imposed by traditional formats (this may change to some degree with electronic publications).

A visual abstract can be created and published alongside the article as supplementary online material, on an independent media-sharing site, or on the author’s website. Once online, the visual abstract acts to attract attention to the paper and allows a deeper exploration of the research described in the text narrative. Most importantly, a visual abstract organizes your research photos to create a coherent narrative—something posting individual images of research cannot do as effectively.

A simple way to create a visual abstract is with a slideshow organized to take the viewer sequentially through each stage of the research. I’ve recently produced two visual abstracts using the presentation application, Prezi. These abstracts are designed somewhat like a poster or infographic, except instead of a static image, they are interactive.

PowerPoint, Keynote, or some other application might be used to create a visual abstract or infographic. I chose Prezi, however, because of its multi-dimensional, non-linear canvas, which lets you create an explorable document that also can be shared easily via a link or embedded in a website. With Prezi, you can arrange the “frames” in a single plane to create a pleasing overview and then use the “zoom” function to bring each frame into full view, creating a narrative.

There are many ways to design a visual abstract. The two examples I created used a simple design with one photograph acting as an anchor image and other images and text provided in frames positioned alongside the main image. I’ve embedded the two Prezi visual abstracts below.

The first visual abstract summarizes a paper to be published in the Annual Review of Marine Science. Even though this paper was a review, I was able to produce an informative visual abstract using photos (and diagrams) that illustrated various aspects of the review topic. The visual abstract distills the paper down to a few key points, which are covered in greater detail in the technical paper. Here is the direct link: http://prezi.com/dtfasu6khdti/?utm_campaign=share&utm_medium=copy&rc=ex0share

The second visual abstract summarizes a paper published in 2008 in the Smithsonian Contributions to the Marine Sciences. Although the paper was published seven years ago, the topic is still relevant. Unfortunately, the paper does not rank high in a Google search. Consequently, I decided to create a visual abstract to help raise the online visibility of the paper. My colleagues and I had taken hundreds of photos during that study that could be used to share information about the study location, the methods, the results, and the broader implications of the work. I selected the best ones and combined them with public domain images, graphs, and text to summarize the study. Here is the direct link: http://prezi.com/vaijezkevszk/?utm_campaign=share&utm_medium=copy&rc=ex0share

As I said, there are many ways to design a visual abstract. Here is another option, which I’ve made available as a free template on the Prezi platform. You can download it and then replace my images and text with your own.

After creating a visual abstract, you can send the link to colleagues or embed it on your website. The ideal approach is to create and post a visual abstract before or concurrent with publication of the paper. That way, the abstract can act like an advertisement for the pending publication and build a pool of potential readers. But there is no statute of limitations on visual abstracts, especially if you’ve got a library of photographs from previously-published studies.

Create a Visual Narrative

Although researchers in your field may be primarily interested in the technical aspects of your work, there is a larger audience of people who want to hear about what motivated you to conduct your study or what it’s like to conduct research on a tropical island in Belize. This group includes students, scientists in other fields, policy-makers, the media, and the general public. Scientists have compelling stories to tell that help others understand the nature of research as well as why scientific research is needed. Such stories are also helpful in getting the average person interested in science and in topics of critical importance to society.

A visual narrative, constructed with a series of photos, can be used to tell the “backstory” of a research project….an expedition to the Congo, for example (see below). Visual narratives can provide insights into a research project that typically do not make it into the journal article but are useful in conveying the challenges researchers faced in collecting samples, the beauty of the ecosystem under threat, or the broader impacts of the findings on society.

Such stories appeal to students and the general public and can get people interested in your research topic.

As you will see in the video below, the filmmaker used mostly still images to tell the story of how researchers from the Woods Hole Research Center studied the Congo River. This example shows that with some creative editing, photographs can be arranged to tell a powerful and effective story.

Some Practical Considerations

You may be wondering just how long does something like this take? In the case of the visual abstracts, the time required was about what it would take to put together a PowerPoint presentation. In fact, for the second visual abstract, I imported a PowerPoint slide deck, which I had previously used for a presentation, into Prezi and then simply rearranged the images and added text. You don’t have to use Prezi, but if you do, it is relatively easy to learn. If you already know how to use movie-editing software (iMovie Tutorial for iOS), creating a visual narrative of still images should not be overly taxing either.

Of course, to create a visual abstract or narrative, you must have the necessary images, and this takes planning. I got into the habit early in my research career of photographically documenting experiments and fieldwork. I made a list of photos I needed and then set aside time during a field trip to search out and snap those images. I took photographs not only of things related to my research but also of the plants, animals, soils, landscapes, and people I encountered. During long field expeditions (a week or more), I would typically spend an entire day just taking photographs. Back in the days of 35 mm film, however, I had to be somewhat parsimonious and carefully select what to photograph. Once digital cameras became available, I spent more time photographing—to document changes in the habitats I studied or to record visual features that might later prove useful in interpreting my results. Now, with phone cameras in our back pockets, it’s even easier to take, store, share, and reuse research photos.

As I’ve explained in a previous post, visuals can help make your research more visible online. Although you might present your research photos individually in an online repository, the viewer likely will have no understanding of what they are seeing or why it is important. I think it is much better to organize those photos to tell a story about your work. Visual abstracts and visual narratives are a great way to accomplish this.

How Making Videos Can Help You Write Better Science Papers: Use Storytelling

storyIn this series of posts, I’ve been explaining how video-making can have a feedback effect on other communication skills such as scientific writing and speaking. In the first post of this series, I described the first lesson I learned, which has had a huge effect on my overall communication skills: Distill Your Message. The second post, Focus on Your Audience, emphasized how changing your perspective to that of the audience can improve your writing.

In this post, I describe how learning to use storytelling techniques to make science videos has shown me how to improve my journal articles and conference presentations.

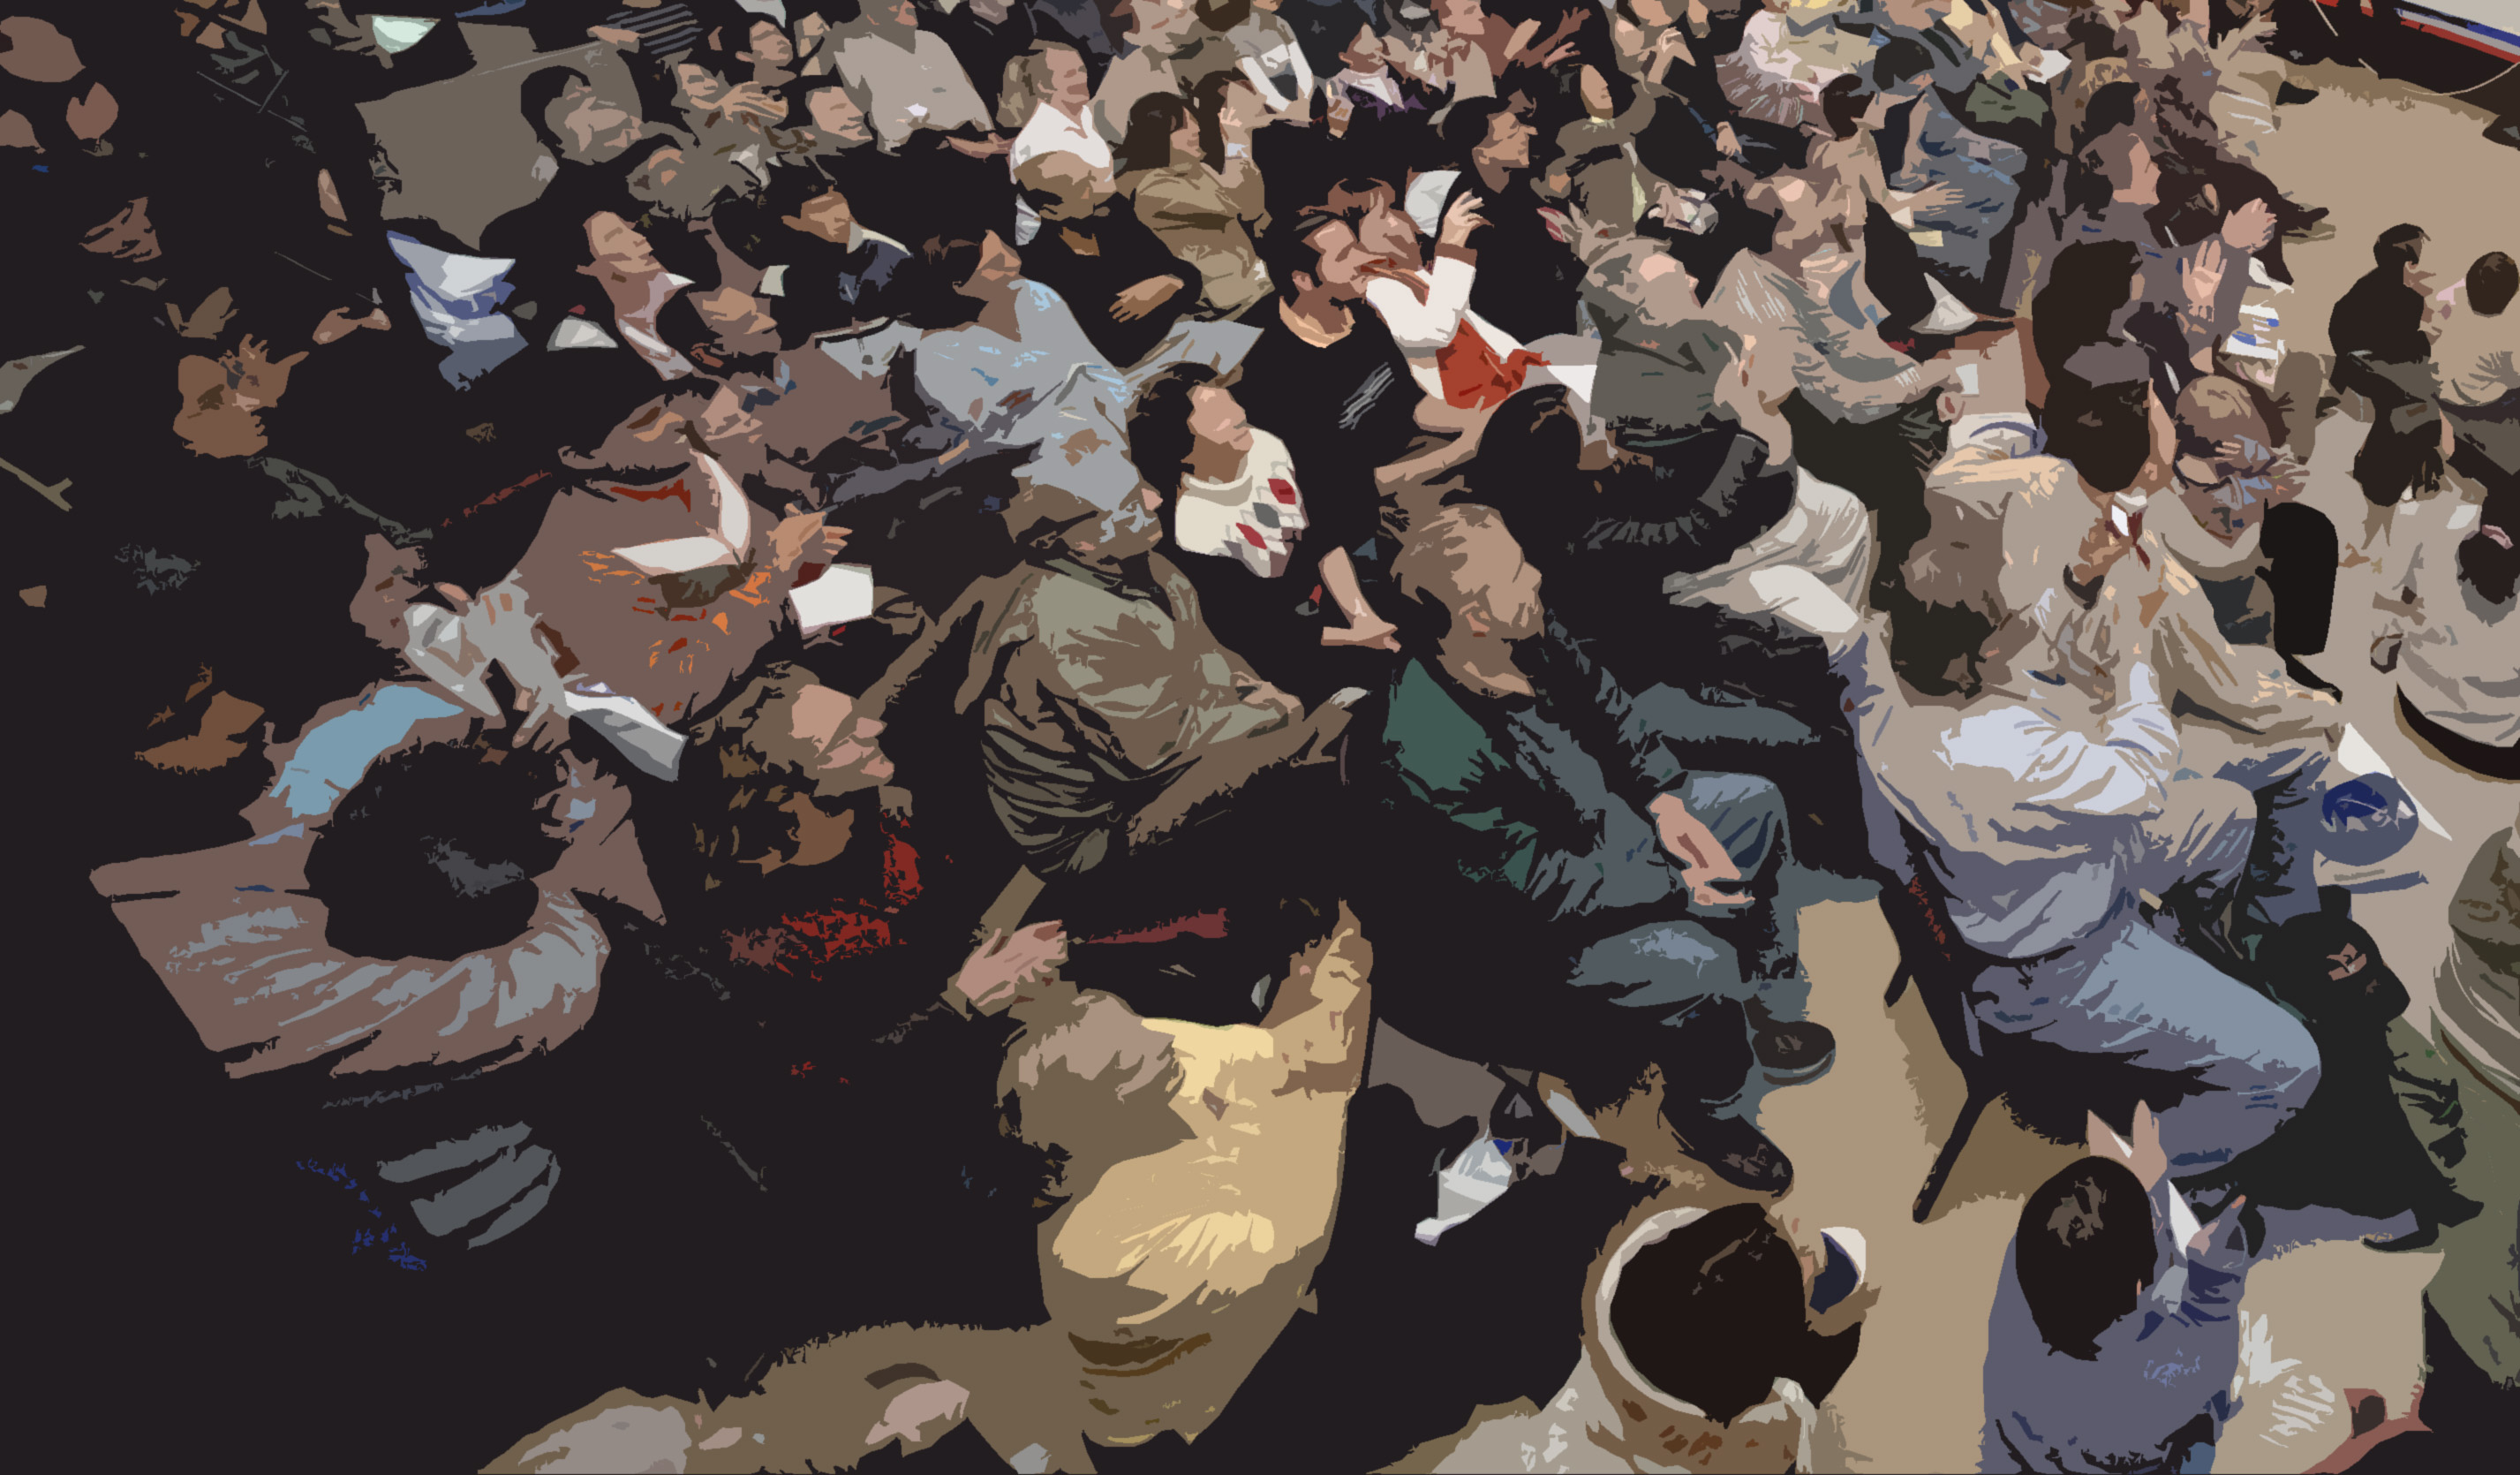
People don’t remember facts and figures, but they do remember a story.

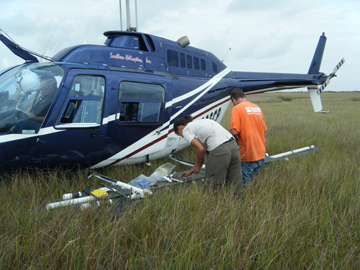
One of the biggest challenges for me in making videos about science has been learning how to let go of my facts and figures and just tell a good story about my work. I know how to tell stories—and I have a lot of them after forty years of field research in remote tropical regions (here’s one). However, it’s hard to put the scientific facts, which I think are important for the reader or viewer to know, into a narrative that holds people’s attention— in a way that doesn’t make me feel uncomfortable about revealing personal information.

I’ve posted previously about the benefits of storytelling in science. Humans are uniquely attuned to stories. People won’t remember data or a list of facts about the importance of tropical forests, but they will remember a story about how you narrowly missed being eaten by a crocodile while collecting soil samples in a Panamanian coastal forest. By telling stories, we can also help overturn stereotypes about scientists. For example, by starting a science talk or video with a brief personal story, we can show that scientists are a varied and interesting group of people who love their work, rather than a bunch of strange nerds with no life outside of the laboratory. TED talks are famous for having speakers tell stories in their science and technology presentations and, consequently, are enormously popular.

Scientific papers are stories, and the author is a storyteller.

But how might storytelling methods be helpful in writing scientific papers or preparing a talk for a technical audience? A story is a narrative that describes a sequence of events in a specific pattern, called the story arc: premise, rising action, climax, falling action, and resolution. The fact that storytelling follows a formal structure is surprising to people who view it as a formless, unpredictable process. Instead, stories follow quite predictable and repeatable patterns (see this video of the author Kurt Vonnegut explaining story patterns).

Similarly, in writing a scientific paper, we don’t simply relate a series of experiments and results in a haphazard way. Our journal articles recount a logical progression of ideas and actions leading to a conclusion: Introduction (what I set out to study and why), Methods (how I did it), Results (what I found), Discussion (what I think it means), and Conclusions (how it fits into the bigger picture). These components of a scientific paper are loosely analogous to the stages in a story arc: introduction/methods = premise, initial results = rising action, main result = climax, discussion = falling action, conclusions/significance/application = resolution. Some authors even identify a protagonist (leading character or hero/ine) and one or more antagonists (adversaries of the protagonist) in a scientific story (Hoffman 2014). Note that the protagonist is not necessarily the scientist, but might be a study organism, a chemical, a physical process, or some other focus of the study.

In other words, our scientific papers are stories, even if they are constructed within a formal framework. That makes us, the author, a storyteller, whether we like it or not, believe it or not.

But how, you may ask, does storytelling help us be better scientific authors?

A clear storyline guides and facilitates writing.

As I suggested in the first post in this series, distilling your message before starting to write a paper will help you develop a clear storyline that will guide your writing. Without this guiding storyline in mind, a writer will often ramble and wander around with no clear path leading to a logical conclusion. I’ve always been pretty good at identifying and expressing my “take-home message” in papers and presentations. However, the process of making videos about my research drove home the value of identifying my “story” before beginning to write.

Prior to filming, I write out what my message is and what information I need to present to get that message across to viewers. Before writing a paper, I pore over my data, statistics, and graphs until I see a clear story, and then I think some more about how it fits into a bigger picture. If I cannot articulate in one or two sentences what I found in a study and put it into a broader context, then I know I’m not ready to begin writing. Once I get that storyline settled, though, I find it much easier to organize my writing and the logical flow of the article to tell a compelling story about my topic.

Key components of a paper should repeat the story.

By key components, I’m talking about the paper title, abstract, and figures—those parts that may be the only ones seen by many readers. If the title is the only thing people see, it needs to express your story: “Land subsidence accounted for half of relative sea-level rise in Chesapeake Bay marshes“. A more expanded, but still condensed, version of the story is given in the abstract (aim, methods, main result(s), interpretation, significance). The paper’s figures are also developed and presented in a way that reiterates the story—that is, someone should be able to look at the figures and tables and grasp what story is being told in the text narrative. In addition, each figure, if well done, can tell a mini-story about each aspect of the study.

These components (title, abstract, figures) happen to be the parts that novice writers leave to the last minute and spend little time crafting. I would argue that these are the first items that should be prepared, and they should be revisited and revised throughout the writing process.

The figures are designed and arranged in sequence, much like a storyboard for a video. 

My first task in writing a paper is to construct the figures and tables. The figures are carefully designed and ordered, with the main figure containing the key finding accompanied by other figures/tables, which provide supportive evidence to confirm the main result or its interpretation. Maps, diagrams, or photos may also be used in the methods to illustrate how and where the study was conducted—but only if they are essential to the reader’s understanding. Any data that do not contribute to the story are placed in a supplemental materials section.

The idea of starting with the visual parts of a paper and arranging them in a particular order is analogous to “storyboarding” in filmmaking. A storyboard depicts a sequence of scenes in a film and shows how the story will progress and what perspectives and media (photos, illustrations, animations) will be used to convey each piece of the story. A paper’s figures (diagrams, photos, drawings, graphs), when arranged in a logical sequence, depict the story of your study in a similar way. I typically redraw and rearrange the figures for a paper several times until I’m satisfied that they tell a coherent story. Only then do I proceed with writing the narrative.

A paper’s title and abstract should give a condensed version of the story.

I learned to craft the titles of my videos so that someone who came across them would decide that they contained the information they were seeking. YouTube viewers, for example, are presented with many choices for any particular topic. Decisions to click on a video link are made quickly based on the title and the thumbnail image. You may have found a video through a set of search terms; if the title tells you that the video is exactly what you are looking for, then you click the link.

The same idea applies to crafting the title of a paper. By articulating your story in the title, you tell a prospective reader what they will find in your paper: “Wetland plant response to elevated CO2 is mediated by salinity and flooding levels“. Contrast that title with this less informative one: “Effects of CO2, salinity, and flooding on wetland plants“. I may later modify the title after the first draft of the manuscript is done, but this initial title helps keep me on track.

I next prepare a draft abstract to tell a condensed version of my story. I like to think of a paper’s abstract as analogous to a movie trailer. The purpose of a movie trailer is to provide a synopsis of a film and to entice people to watch the movie. Similarly, an abstract’s purpose is to provide a brief summary of a paper and convince people to read the full paper. The movie trailer analogy is not so far-fetched, as some journals are now encouraging video abstracts, in which the authors explain their study using audiovisual media instead of text. There is even software (iMovie) that facilitates the creation of a trailer about a scientific publication.

Use Search Engine Optimization (SEO) to increase a paper’s discoverability.

When I started making videos, I quickly realized that I needed to craft the video titles, descriptions, and tags so that people searching online could easily find them and, once found, would decide to watch them. This attention to online discoverability is termed Search Engine Optimization (or SEO). After observing that my choice of wording affected the numbers of viewers playing my videos, I realized that the same SEO could be applied to scientific papers.

Because titles are particularly important to search engines, a paper’s title should be carefully written to contain key search terms— that is, words that someone would use to look for a paper in your subject area. The keyword field, similar to “tags”, should additionally include common search terms not included in the title. For example, if I’m writing a paper on the effects of atmospheric CO2 on plants, a search term I would include in the keyword list is “climate change”. Finally, the abstract should repeat key terms contextually throughout because search algorithms assess repetition in assigning ranking of a text link. More about SEO for scientific articles can be found here.

Let the audience participate in crafting the story.

In making a science video, too much information can annoy the viewer and obscure the key message. The same is true for a scientific paper or presentation. An early mistake I made in scientific writing was that I provided too many details—that is, I described every blip in the data and then tried to explain them all in the discussion section (no wonder my early papers went way, way over the word limit). A better way is to describe general patterns and let the reader pore over the details provided in figures and tables—where they will see that your description and interpretation of the patterns make sense.

At the other extreme, are writers who provide too little information and, consequently, cause the reader to question the validity of the conclusions. They set out a few breadcrumbs along the path but not enough for the reader to easily follow. Writers in this category are often novices who are timid or uncertain about how to interpret their data. They try to write their papers with no storyline and end up wandering around and never arrive at a satisfactory conclusion.

The scientific storyteller should provide just enough detail to lead the reader toward a logical conclusion, which they are more likely to accept because they participated in the interpretation. In other words, let the reader do some of the mental work. This shared mental effort is used to great effect in filmmaking when some things are left to the viewer’s imagination (think about the shower scene in Alfred Hitchcock’s Psycho). Similarly, the scientist storyteller can allow some leeway for the reader to interpret the presented data and to ponder alternative explanations.

What about the naysayers?

I realize that some scientists strongly object to the idea of storytelling in constructing papers—they argue that it can lead to a distorted, not-quite-truthful narrative (see Katz 2013 but see the original article and reply by the authors to these charges). Or that the story is presented as the only way to interpret the data—leaving no room for other explanations. This negative view of storytelling is based on a false set of assumptions.

One assumption is that the scientist storyteller embellishes, obfuscates, or somehow presents something that is not supported by the data. This is a false assumption based on the idea that all storytellers exaggerate or fabricate their material to better entertain audiences (Katz 2013). For one thing, this characterization may apply to some storytellers, certainly those weaving fictional tales, but not to all raconteurs. Also, the main purpose of a scientific paper is not to entertain but to inform, and this difference in purpose affects how storytelling is applied. For example, one of my goals in writing a paper is clarity, and having a clear story in mind helps me accomplish this. This approach is not embellishment or fabrication; it’s lucidity. Without a clear story, I’m just wandering in a scholarly wilderness—and dragging the unfortunate reader along with me. I doubt that I would have gotten many papers published had I simply provided a data dump and invited the reader to figure it out on their own.

Another false assumption is that storytelling in science leads to bias (Katz, 2013). In other words, a scientist has a pre-conceived story in mind and presents only those findings that are compatible with it. Bias is always a danger in science, but I don’t think striving to tell a coherent story necessarily promotes or is evidence of bias. As authors, we have an obligation to present our findings in a comprehensible sequence and to guide the reader in their interpretation. For example, we don’t present in a paper the results of experiments in the actual sequence they were conducted; instead, they are re-ordered to make it easier for the reader to follow and understand the material.

I think that we can apply storytelling techniques to scientific writing without compromising accuracy, veracity, or credibility of a paper. An editorial in Nature Methods (Should Scientists Tell Stories), in response to the Katz 2013 piece, states:

Scientists are not automata and, in today’s world, operate under substantial time pressures. Even if the scientist’s colleagues in this idealized setting had the patience and time to navigate through a long, uninterpreted, purely factual exposition and to sufficiently grasp what was done and its significance, it would still be a cripplingly inefficient process….An argument for papers written purely as a factual blow-by-blow account of experiments does not sufficiently take into account this reality.

As for me, I would much rather read a paper that weaves a fascinating, true tale of scientific discovery than one in which the authors have simply provided a detailed record of their study. I strive to make my papers both enjoyable to read and memorable, and a dry recitation of the findings does not make for an indelible paper. Telling an interesting story, i.e., leading the reader through a maze of data and showing them something they had not considered before, helps a paper become memorable.

As I said at the beginning of this post, stories are a form of communication that humans recognize and remember. Why not take advantage of this deeply human characteristic and use it to develop better, and more truthful, narratives about our science?

How Making Videos Can Help You Write Better Science Papers: Focus on Your Audience

nasa_crowd_dominichart_cropped_filtered

Credit: Dominic Hart, NASA

In this series of posts, I’m talking about the feedback effect video-making can have on other communications skills such as scientific writing and speaking. When I decided to add video to my communication toolbox, I had no inkling that learning to use this medium would show me how to improve my scientific papers and conference presentations.

In the first post of this series, I described the first lesson I learned, which has had a huge effect on my overall communication skills: Distill Your Message.

In this post, I discuss how I learned to put myself into my audience’s shoes, which dramatically changed my approach to communication, both technical and non-technical.

What you want to present is not necessarily what your audience needs.

Poor communicators tend to ignore the needs of their audience. When speaking or writing, they assume that their audience has the same level of understanding as they do. If the audience gets lost, too bad. You’ve all read papers or heard presentations that were a struggle to understand. You may have even decided that it was your fault—that your lack of comprehension was due to a lack of background in whatever topic was being presented. Actually, the fault lies entirely with the author or presenter.

Scientists are not really taught to consider the audience’s viewpoint. At least, I wasn’t. I never really thought much about whether other people understood me until I began making videos. Because I was targeting a lay audience with my early videos, I vaguely understood that I had to use jargon-free, simpler language to be understandable. Only later did I realize that this was not enough.

My problem was that I was presenting information I wanted the viewer to know— rather than what they needed to know. I also learned that I needed to use a structure that would ensure they would pay attention and remember my information. What I thought was important (facts and figures) was quickly forgotten by the viewer—especially when presented as a scientist would normally do it; that is, in a boring, pedantic way.

Audience understanding depends on both content and structure (of the message).

The upshot of all this was that I realized something important about communication that I could apply to my writing and speaking skills. When someone considers a piece of information, their comprehension depends not only on the content but how the content is structured. The effect of structure on comprehension is true for a video viewer, a reader of a scientific paper, or an audience member listening to a speech.

Your audience must expend mental energy taking in the content, but they also have to strive to understand your word choice, syntax, and emphasis. The point is that you can make it easy for the viewer or reader to grasp the substance of your information or you can make it difficult by using tortuous language. It doesn’t matter if you are dealing with a lay audience or a group of specialists in your field. If you use cryptic, equivocal, or imprecise language, you risk the audience misinterpreting your message.

Scientists are rarely trained to write and speak clearly and effectively; we are expected to develop these skills on our own. Consequently, I see many student manuscripts that contain important data, but the writing is ambiguous and poorly worded; it wanders all over the place with no clear argument or even a hint as to what the “take-home message” is. Lest you think I’m picking on students, let me add that established scientists can be even worse. Let’s consider a random abstract picked from the literature:

The discrete-dipole approximation (DDA) for scattering calculations, including the relationship between the DDA and other methods, is reviewed. Computational considerations, i.e., the use of complex-conjugate gradient algorithms and fast-Fourier-transform methods, are discussed. We test the accuracy of the DDA by using the DDA to compute scattering and absorption by isolated, homogeneous spheres as well as by targets consisting of two contiguous spheres. It is shown that, for dielectric materials (¦m¦ ≲ 2), the DDA permits calculations of scattering and absorption that are accurate to within a few percent.”

Confused? Did you give up about half-way through? Much of the problem lies in the structure of the abstract, not with the jargon (Gopen and Swan 1990). Here is a translation:

We reviewed the use of a computational method (DDA), tested its accuracy in computing light scattering and absorption by different types of spheres, and found the method to be highly accurate.

Even if you are communicating with a specialist audience in your field, you need to consider their needs and make it as easy as possible for them to understand what you did, what you found, and why it is important.

Although it’s impossible to ensure that everyone will understand everything you say, you can increase the chances that most of your readers will interpret your material as you intended by structuring it in a way that meets their expectations. To be successful in communicating a complex science finding, a writer must understand how important language and sentence structure are and how to apply it. See Gopen and Swan 1990 for an in-depth look at the science of scientific writing.

Improve audience understanding by changing your perspective.

Communicating with a non-specialist audience is a particular challenge because it’s not easy for scientists to imagine what their audience or readers know or need to know. We suffer from the curse of knowledge, which cannot easily be set aside. One remedy is to ask yourself simple questions about a prospective audience. Do they know what DNA is? Have they heard of sea-level rise? Are they science literate but know nothing about your particular topic?

Most scientists never go though this exercise, but it can really teach you how to think clearly about your topic and then to explain it to someone else. Why is your research important to society? What is innovative or new? Are there some interesting applications based on your work? In the process of answering such questions, we discover a new way of looking at our science. By putting ourselves in our audience’s shoes, we shift our perspective and see things differently—from a focus on the minutiae of our study to the big picture.

If we are clear in our own minds about the significance of our research, we can more easily express it in a paper or tell a conference audience how our findings will advance knowledge. Clearly explaining the importance of your research findings in a paper or what you plan to do in a proposal will make it easier for reviewers to check the “accept” or “fund” box.

The next post in this series: Use Storytelling Techniques