Writing a scientific article can be an intimidating and challenging task for first-timers. I vividly recall my first effort. I was initially overwhelmed with the idea because I was thinking about the entire paper in the same way an amateur mountaneer might view Mt. Everest: one long climb to the top. How would I ever reach the summit when I’ve never set foot on a mountain before?
(Image by Uwe Gille, CC-BY-SA 3.0)
Fortunately, someone suggested to me that I break the job down into small parts and stop thinking about it as one huge task. They also suggested that I study published papers to see how each section was structured and then organize my narrative in a similar way. This piece of advice—to study the structure and writing style of well-written articles—helped me enormously, especially in the early days of preparing research articles for publication.
Over the succeeding years, I periodically “analyzed” papers—those in high-impact journals as well as those I just enjoyed reading—to discover ways to improve my own writing. Along the way, I realized that getting one’s work into top journals depended on how well the paper was written, in addition to ground-breaking research findings. I thus found it strange that my professors did not coach students in improving the quality of their scientific writing. A few professors had their students analyze papers in courses or lab group discussions, but the focus was on evaluating the science aspects of the article rather than the writing.
One section of my scientific papers that I initially did not spend much time crafting was the abstract. Like many novice writers, I left the abstract until last and then dashed off a mediocre summary composed of sentences mostly cut and pasted from the narrative. It was only much later that I understood the abstract to be one of the most important components of a scientific paper. The abstract is often the only section of a paper that is read. More importantly, the abstract can determine whether a reader downloads and reads the rest of the paper. Or, in the case of a conference paper, the abstract will determine whether it is accepted or not for presentation to colleagues. Journal editors and reviewers and conference organizers pay close attention to the abstract because it is a good predictor of the quality of the paper. A poorly written or mediocre abstract says the author is inexperienced or doesn’t care about quality.
Writing a decent abstract is not difficult…if you know what information needs to be included and how to structure it. The presentation embedded below explains how to write an abstract using a real example of a published abstract. I selected the example from one of my own publications–not because it’s particularly good, but because it illustrates some dos and don’ts. And, by using one of my own publications, I won’t embarrass anyone but myself!
Note that there is audio associated with each slide, so be sure to adjust the volume on your device (here is a direct link in case you cannot see the player window below).
Knowing how to condense a scientific article into a short, coherent summary is a handy skill that all science professionals should attain. If you’ve never written an abstract before, this guide should make the task a bit easier.
Tons of garbage are floating around in the world’s oceans. Where does it go? What might the patterns of garbage movement reveal about ocean currents?
NASA’s Data Visualization Studio has created a series of animations of the so-called ocean garbage patches. They used data collected by floating, scientific buoys that NOAA has been deploying for the past 35 years. The resultant videos dramatically illustrate how large garbage patches develop in the ocean.
In a series of videos, NASA animators show the buoys as white dots against a world map and where they have moved over time. You can see where the buoys move in two different simulations: one based on the actual deployment date and one in which all buoys are released simultaneously. The animations clearly show garbage migration patterns.The buoys end up in one of five known gyres in the ocean, where the largest ocean garbage patches develop.
NASA animators also used a computational model of ocean currents called ECCO-2 to see how ocean currents would move simulated buoys if they were released evenly around the world. In all these visualizations, the buoys end up in the same regions of the ocean.
Below, is one of the NASA videos that summarizes the above information:
Increasing numbers of scientists and graduate students are posting videos that show various aspects of their research—in the laboratory and the field. Such videos serve many purposes, both for the researcher and for society. Take a look at this example and then we’ll talk about the benefits of making such a video.
Videos that depict scientists and students doing their research can have multiple benefits—both for the individual researcher, as well as for society.
1. Raise visibility. Early career scientists struggle to make a name for themselves in their chosen field. The traditional approach is to publish in journals and to present at science conferences. Those forms of formal communication of science are still important, but now there are additional tools that scientists can use to share their work: social media, science blogs, and videos. The video example above highlights the dissertation research of a Ph.D. student at Charles Darwin University, Mike Miloshis, who is studying how sea-level rise is changing the wetlands along the Mary River. Well-done videos like this can be used by the student or by the student’s department or university to more easily share their work with prospective employers or funders, policy-makers, the media, and the general public.
2. Solicit funding. Video is an excellent way to explain your research to prospective funders—particularly people without a science background. Crowd-funding platforms are springing up that require investigators to submit their research proposal in the form of a brief video. Members of the scientific community and the general public watch the videos and pledge a donation or vote for those projects they wish to support. One example is Thinkable, which just awarded $5,000 (AUD) to an Australian cancer researcher and is about to award almost $15,000 (AUD) in another competition based on submitted 3-minute videos.
Those students and established scientists with video skills are at a clear advantage in such competitions.
3. Augment a CV or resume´. Video is an effective and efficient way to share information about a researcher’s unique interests, skills, and accomplishments. A video can paint a picture that is more distinctive and memorable than a written description in a resume´ or on a website. In a few short minutes, the video above showed this researcher’s general knowledge of his topic and ability to communicate it, as well as his expertise with various types of scientific equipment. Because it’s visual, video makes that information more memorable. It’s especially effective at getting across intangible qualities such as enthusiasm, confidence, energy, creativity, eloquence, and humor.
See this post for more information about making a video resume´.
4. Recruit students. A video can not only solidify a distinctive image for a researcher, it can serve as a great recruiting tool for an academic looking to attract students or post-docs. The video above depicts what it’s like to do river research and explains why the topic is important to study without getting too bogged down in scientific details. In a broader sense, such videos can show other students what graduate research is like in a particular field and what some of the challenges are.
By encouraging students to make videos about their experiences, schools can attract prospective students and help them anticipate what they will face in graduate school.
5. Inform the public. In addition to benefits for the individual researcher, videos can simultaneously inform the public about the importance of a research topic and the nature of scientific research. The average person is curious about science but may view it as a mysterious process conducted behind closed doors by socially awkward, introverted, cold, mad, obsessive, [insert your stereotype] people. Many envision a lab-coated, old guy toiling away in a laboratory.
Videos like the above example show that research is carried out in all kinds of environments and by perfectly normal people. In other words, videos can help put a human face on science.
How do you create a video to portray your dissertation research? You have a couple of options: join forces with a videographer or do it yourself. The video example I’ve highlighted in this post was a joint production between the graduate student and a videographer friend. If you are studying at a university, try approaching someone with multimedia skills.
If that doesn’t work out, you can make the video by yourself or perhaps with the help of a fellow student or your advisor. Making videos is now quite easy with mobile devices that shoot HD video and simple-to-use yet powerful movie editing software. A smartphone is truly all you need these days to create a professional and effective video to share your unique qualities with others.
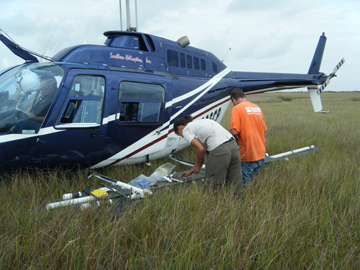
Many researchers, especially those of us who conduct fieldwork, have thousands of photos taken during the course of studies we have conducted—of field sites, equipment, procedures, study organisms, and people. Take the photo at left, for example. I took it during a helicopter survey of marsh sedimentation following the 2011 flood of the Mississippi River. The data we collected were ultimately reported in a couple of journal articles, here and here, but most of the photos remain unpublished.
Photos like this, however, are useful in documenting the conditions encountered during field trips, the procedures employed to collect samples, experimental setups, laboratory protocols, as well as many other aspects of the research. In this study, I additionally photographed each sample site from the air and on the ground, generating a visual record of the vegetation and landscape features.
Scientists most often use such research photos in presentations given at conferences or seminars and, to a lesser extent, in journal articles and book chapters. Some of us also share random images through social media (Twitter, Facebook, Instagram). In most cases, though, these photos simply sit in our files and never see the light of day. This is unfortunate, however, because such images represent important and potentially useful information.
How can we put our research images to better use?
There are many possibilities, but I’ll focus on two options in this post, which is to use photos to craft (1) a visual abstract that summarizes a journal article and (2) a narrative that delves into those aspects of research that are not typically described in a paper (the challenges you faced during the study, the importance of your work to society). In both cases, the researcher is able to visually amplify their work and share it with others.
Create a Visual Abstract
One way to use research photos is to augment a journal article with a visual abstract, which is a summary that uses images instead of text to briefly describe the findings of a study. Research photos can be combined with diagrams, graphs, animations, and text to provide a visually-rich overview of the study. These are images that enhance understanding of the research methods, study sites, potential applications, and other aspects, but are typically not included in journal articles because of page limitations and other constraints imposed by traditional formats (this may change to some degree with electronic publications).
A visual abstract can be created and published alongside the article as supplementary online material, on an independent media-sharing site, or on the author’s website. Once online, the visual abstract acts to attract attention to the paper and allows a deeper exploration of the research described in the text narrative. Most importantly, a visual abstract organizes your research photos to create a coherent narrative—something posting individual images of research cannot do as effectively.
A simple way to create a visual abstract is with a slideshow organized to take the viewer sequentially through each stage of the research. I’ve recently produced two visual abstracts using the presentation application, Prezi. These abstracts are designed somewhat like a poster or infographic, except instead of a static image, they are interactive.
PowerPoint, Keynote, or some other application might be used to create a visual abstract or infographic. I chose Prezi, however, because of its multi-dimensional, non-linear canvas, which lets you create an explorable document that also can be shared easily via a link or embedded in a website. With Prezi, you can arrange the “frames” in a single plane to create a pleasing overview and then use the “zoom” function to bring each frame into full view, creating a narrative.
There are many ways to design a visual abstract. The two examples I created used a simple design with one photograph acting as an anchor image and other images and text provided in frames positioned alongside the main image. I’ve embedded the two Prezi visual abstracts below.
The first visual abstract summarizes a paper to be published in the Annual Review of Marine Science. Even though this paper was a review, I was able to produce an informative visual abstract using photos (and diagrams) that illustrated various aspects of the review topic. The visual abstract distills the paper down to a few key points, which are covered in greater detail in the technical paper. Here is the direct link: http://prezi.com/dtfasu6khdti/?utm_campaign=share&utm_medium=copy&rc=ex0share
The second visual abstract summarizes a paper published in 2008 in the Smithsonian Contributions to the Marine Sciences. Although the paper was published seven years ago, the topic is still relevant. Unfortunately, the paper does not rank high in a Google search. Consequently, I decided to create a visual abstract to help raise the online visibility of the paper. My colleagues and I had taken hundreds of photos during that study that could be used to share information about the study location, the methods, the results, and the broader implications of the work. I selected the best ones and combined them with public domain images, graphs, and text to summarize the study. Here is the direct link: http://prezi.com/vaijezkevszk/?utm_campaign=share&utm_medium=copy&rc=ex0share
As I said, there are many ways to design a visual abstract. Here is another option, which I’ve made available as a free template on the Prezi platform. You can download it and then replace my images and text with your own.
After creating a visual abstract, you can send the link to colleagues or embed it on your website. The ideal approach is to create and post a visual abstract before or concurrent with publication of the paper. That way, the abstract can act like an advertisement for the pending publication and build a pool of potential readers. But there is no statute of limitations on visual abstracts, especially if you’ve got a library of photographs from previously-published studies.
Create a Visual Narrative
Although researchers in your field may be primarily interested in the technical aspects of your work, there is a larger audience of people who want to hear about what motivated you to conduct your study or what it’s like to conduct research on a tropical island in Belize. This group includes students, scientists in other fields, policy-makers, the media, and the general public. Scientists have compelling stories to tell that help others understand the nature of research as well as why scientific research is needed. Such stories are also helpful in getting the average person interested in science and in topics of critical importance to society.
A visual narrative, constructed with a series of photos, can be used to tell the “backstory” of a research project….an expedition to the Congo, for example (see below). Visual narratives can provide insights into a research project that typically do not make it into the journal article but are useful in conveying the challenges researchers faced in collecting samples, the beauty of the ecosystem under threat, or the broader impacts of the findings on society.
Such stories appeal to students and the general public and can get people interested in your research topic.
As you will see in the video below, the filmmaker used mostly still images to tell the story of how researchers from the Woods Hole Research Center studied the Congo River. This example shows that with some creative editing, photographs can be arranged to tell a powerful and effective story.
Some Practical Considerations
You may be wondering just how long does something like this take? In the case of the visual abstracts, the time required was about what it would take to put together a PowerPoint presentation. In fact, for the second visual abstract, I imported a PowerPoint slide deck, which I had previously used for a presentation, into Prezi and then simply rearranged the images and added text. You don’t have to use Prezi, but if you do, it is relatively easy to learn. If you already know how to use movie-editing software (iMovie Tutorial for iOS), creating a visual narrative of still images should not be overly taxing either.
Of course, to create a visual abstract or narrative, you must have the necessary images, and this takes planning. I got into the habit early in my research career of photographically documenting experiments and fieldwork. I made a list of photos I needed and then set aside time during a field trip to search out and snap those images. I took photographs not only of things related to my research but also of the plants, animals, soils, landscapes, and people I encountered. During long field expeditions (a week or more), I would typically spend an entire day just taking photographs. Back in the days of 35 mm film, however, I had to be somewhat parsimonious and carefully select what to photograph. Once digital cameras became available, I spent more time photographing—to document changes in the habitats I studied or to record visual features that might later prove useful in interpreting my results. Now, with phone cameras in our back pockets, it’s even easier to take, store, share, and reuse research photos.
As I’ve explained in a previous post, visuals can help make your research more visible online. Although you might present your research photos individually in an online repository, the viewer likely will have no understanding of what they are seeing or why it is important. I think it is much better to organize those photos to tell a story about your work. Visual abstracts and visual narratives are a great way to accomplish this.
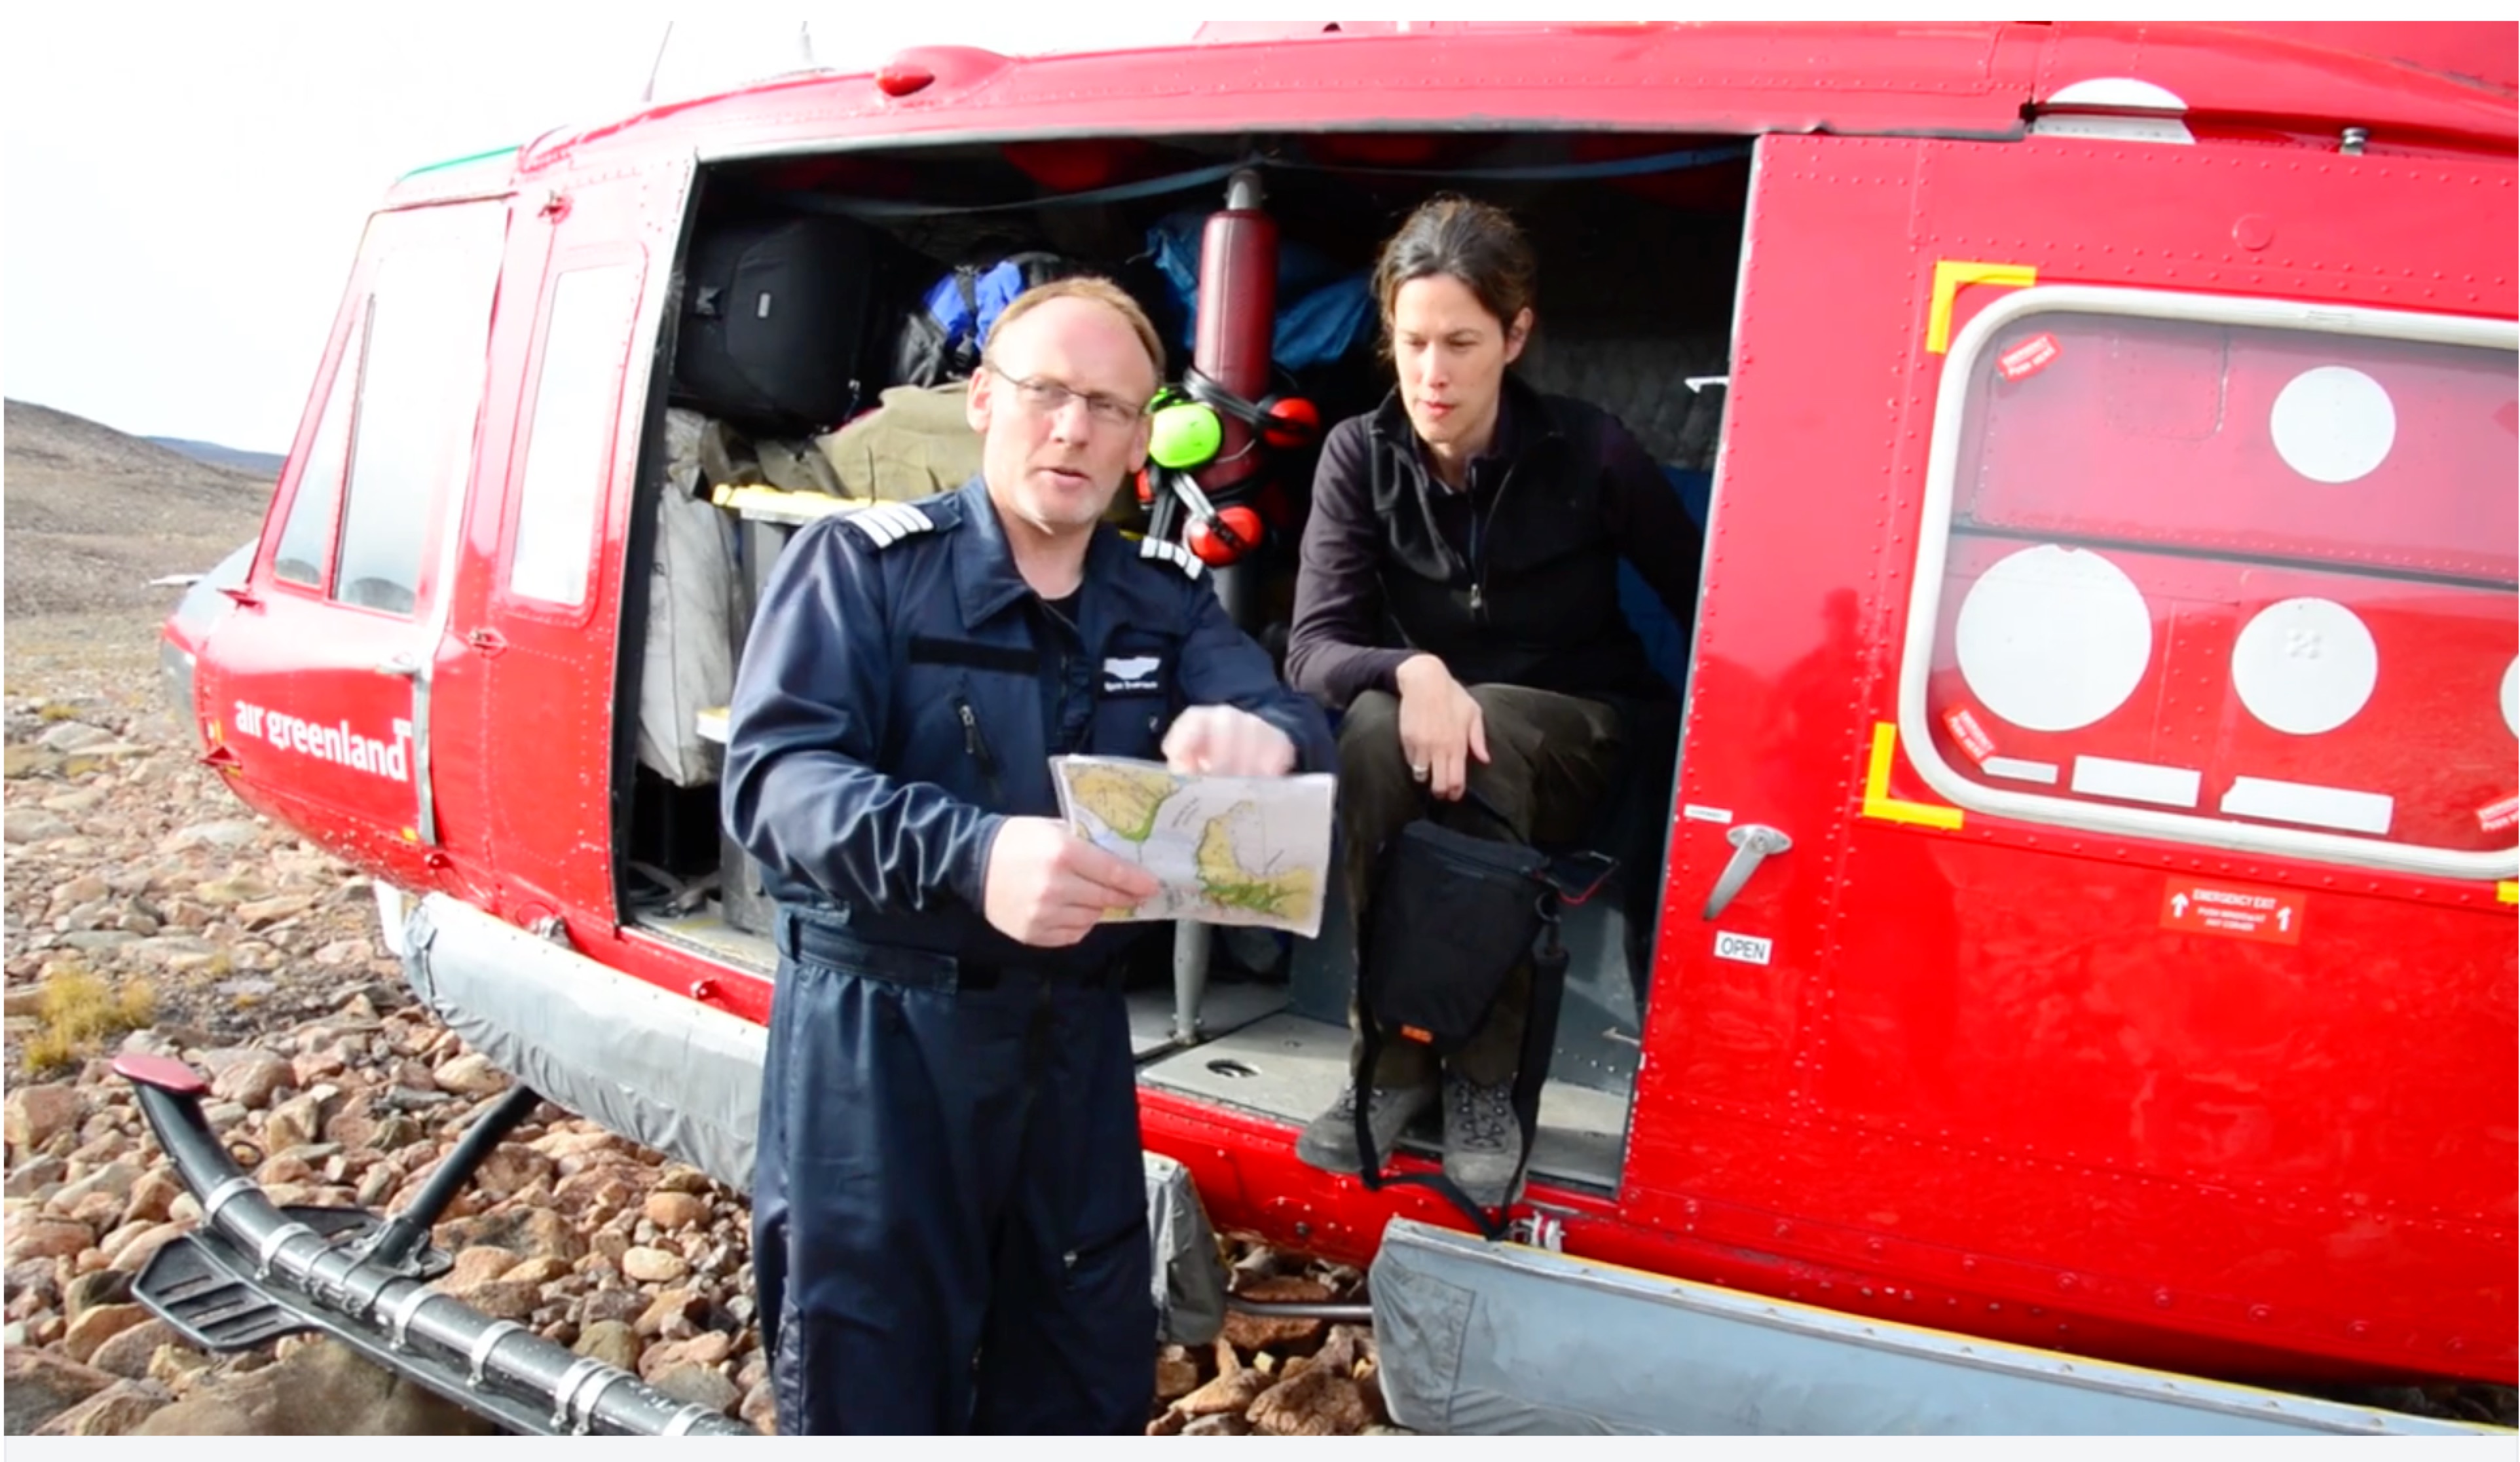
We see an apple-red helicopter taking off from a rocky outcrop and hear a voice saying, “The area we study is so remote. It’s kind of like working on the moon might be.”
That’s the leader of a research team from Northwestern University talking about a research expedition to study climate change in Greenland.
We then hear from a graduate student, who says, “I consider myself very fortunate to be able to spend a month and a half in the high Arctic at seventy degrees north.”
That is how a video called “Extreme Science in the Arctic” begins. It goes on to show the research team extracting sediment cores from the bottom of an Arctic lake and to explain the scientific and other challenges they face in collecting data in this inimical landscape. This video does a great job of showcasing the research of the Principal Investigator, Yarrow Axford, and emphasizes the incredible field experience her students receive.
As I’ve mentioned in previous posts and on my About page, there are many good reasons for a scientist to take the time to produce videos. One of the most important reasons is to promote one’s research program to funding agencies, potential collaborators, and future students. A video can readily convey your expertise in a field of study, involvement in multi-disciplinary projects, or opportunities for students who work with you.
Videos can be especially effective in showing prospective graduate students what your research is all about, as well as something about you and what it might be like to work with you. A video featuring you and your current students conducting research on the Great Barrier Reef, searching for an endangered species in Central America, or investigating wetland loss in the Mississippi River Delta is a great advertisement. As a lab-based scientist, you may be exploring new ways to treat cancer or the genetics of mental illness. Even if you are not doing research on the hot topic of the day, you can still create a video that is appealing and that might interest a student who is undecided about a topic or a graduate adviser.
In planning your video, decide on a goal. Are you mainly interested in attracting top students to your program? If so, such a video should clearly show what students are going to be wanting to know about your program: Is this research program interesting? What does this research involve: field work or lab work or both? Is the professor a good adviser? Will I enjoy working with this research team? Will I gain unique experience in a topic that interests me?
Or you may want to create a video that summarizes the broader impacts of your research. Such a video may be used to meet the expectations of funding agencies (NSF, NIH), which ask principal investigators to show how their work affects society, e.g., via education or outreach.
A video can also serve to show potential collaborators where their research interests overlap with yours. Scientists rarely read papers in other fields. An interesting video, however, might attract viewers curious about your topic and spark an idea for a joint project.
Near the end of the “Extreme Science in the Arctic” video, a scene shows melt water flowing in a cascade off a multi-layered ice cliff. The narrator says, “This work will be used by scientists around the world who are urgently trying to predict how the Earth’s ice sheets will respond to a warming climate.”
 Writing a scientific article can be an intimidating and challenging task for first-timers. I vividly recall my first effort. I was initially overwhelmed with the idea because I was thinking about the entire paper in the same way an amateur mountaneer might view Mt. Everest: one long climb to the top. How would I ever reach the summit when I’ve never set foot on a mountain before?